It is always dangerous to draw too many parallels between companies, and yet benchmarking is one of the most effective ways of expressing comparative performance. The Gartner Supply Chain Top 25, which was started by AMR nearly 10 years ago, is an annual ritual that draws a great deal of attention. The Garter Supply Chain Top 25 also draws some criticism because it tries to compare companies across industries. Nevertheless there are a few supply chain insights we can draw from the list in general and for the pharmaceutical supply chain manufacturers in particular.
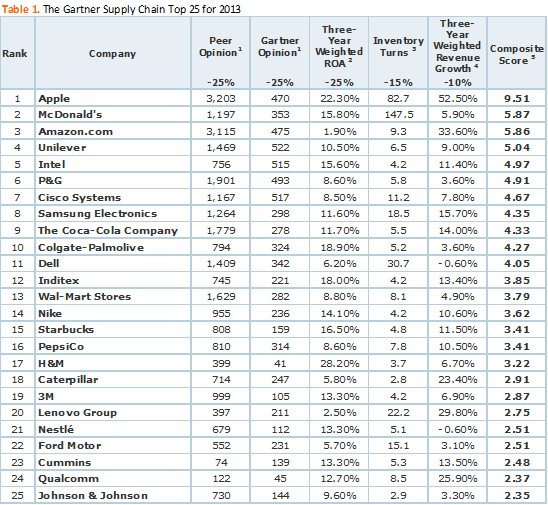
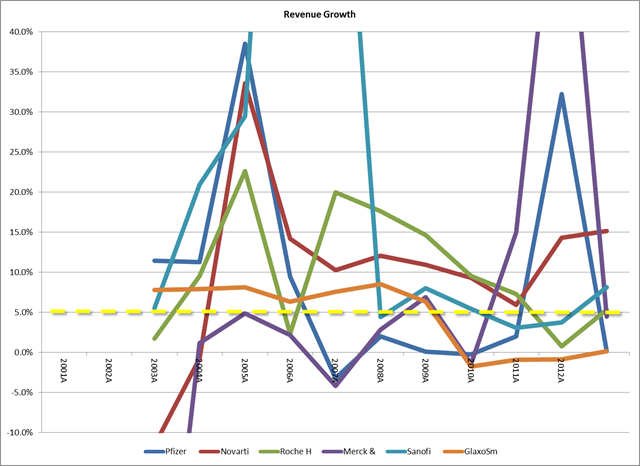
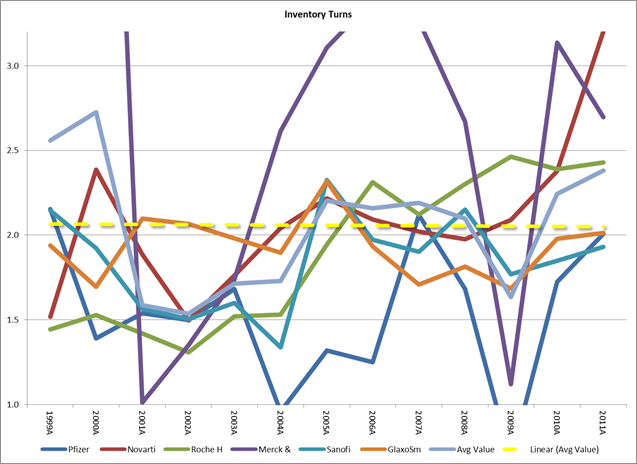
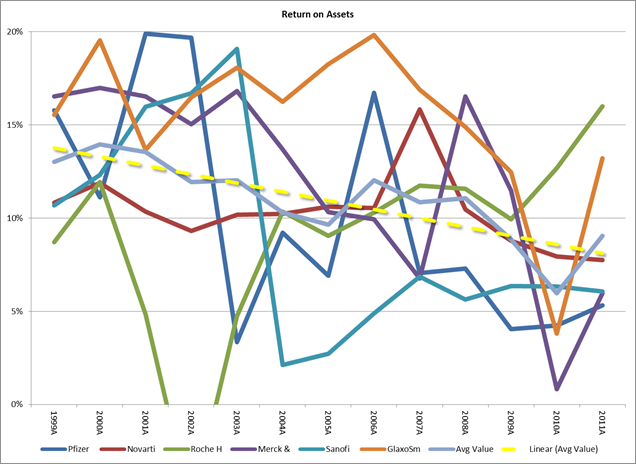
The list tries to balance aspects of product innovation through revenue growth, efficient use of capital through return on assets (ROA), and efficient supply chain practices through inventory turns, balancing the various aspects of Operations that will lead to long term profitability and market performance. It is important to note that only one pharmaceutical manufacturer is on this list, namely J&J, at number 25. Gartner also publishes a Healthcare Supply Chain Top 25, but even this list compares manufacturers, distributors, and providers, each of which have very different supply chain characteristics, making an apples-to-apples comparison difficult. Even within the manufacturers the list does not distinguish between small molecule and biological manufacturers, which have very different supply chain characteristics. So I set out to look at just the small molecule manufacturers with the greatest revenue, which are based in the US or Europe. It is not a pretty picture. Perhaps what surprised me most was the inconsistent performance over the past 10-15 years across the metrics used by Gartner to evaluate performance. We all know Wall Street rewards consistent, and positive, performance. Potentially, the greatest surprise to me is the manufacturers inability to reduce inventory levels, which have remained flat at a little over 2 turns, and the most disappointing is the large drop in return on assets, from about 14% in 1999 to about 8% in 2011. While the average revenue growth has been consistent at about 5%, the annual fluctuations have been huge.
Pharmaceutical Supply Chain: Revenue Growth
Pharmaceutical Supply Chain: Inventory Turns
Pharmaceutical Supply Chain: Return on Assets
My view is that these metrics reflect relatively immature supply chain practices in large pharmaceutical companies. It is little wonder given the attention paid to R&D and their high gross margins.
But there are some pharmaceutical supply chain industry trends that I hope will encourage pharmaceutical companies that they can combine their expectations of high customer service with more efficient supply chains that require less cash to operate. I will be discussing the industry trends and the concept of a control tower to drive much greater supply chain effectiveness with Roddy Martin of Accenture, formerly of AMR Research, this coming Wednesday July 10th, 2013. Please join us to hear our point of view and share your ideas. You can register for the webinar by clicking on the following link.
Leave a Reply